Repeated Pattern Detection of Printed Fabric
Table of Contents
Abstract
We study the problem of detecting repeated patterns. Our goal is to extract a single unit of repeated patterns from an input image. This problem can be simplified for printed fabric because of its strictly regular and fronto-parallel nature. Under these properties, we investigate two algorithms. The first one uses Fourier analysis, but it is not suitable for our purpose because it requires additional assumptions about the period of the image. The second algorithm involves shifting the image and calculating the distance using the $L_2$ loss function. This method can efficiently solve the problem compared to human processing on our dataset.
1. Introduction
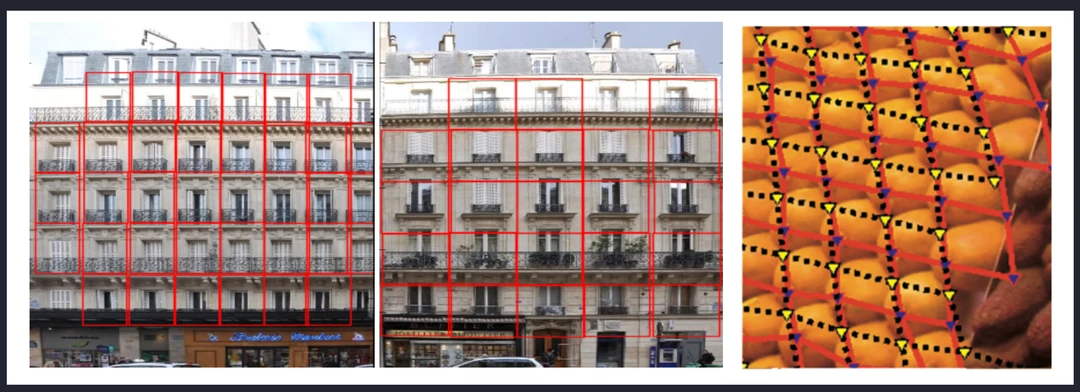
Repeated patterns are prevalent, particularly in human-made objects, as illustrated in the Fig. 1 (a). They offer insights into the object, such as allowing us to estimate the number of floors and the structure of a building ( Citation: Lettry, Perdoch & al., 2017 Lettry, L., Perdoch, M., Vanhoey, K. & Van Gool, L. (2017). Repeated pattern detection using CNN activations. 2017 IEEE Winter Conference on Applications of Computer Vision (WACV). 47–55. ) or count the number of objects in an image ( Citation: Park, Brocklehurst & al., 2009 Park, M., Brocklehurst, K., Collins, R. & Liu, Y. (2009). Deformed lattice detection in real-world images using mean-shift belief propagation. IEEE Transactions on Pattern Analysis and Machine Intelligence, 31(10). 1804–1816. ) .
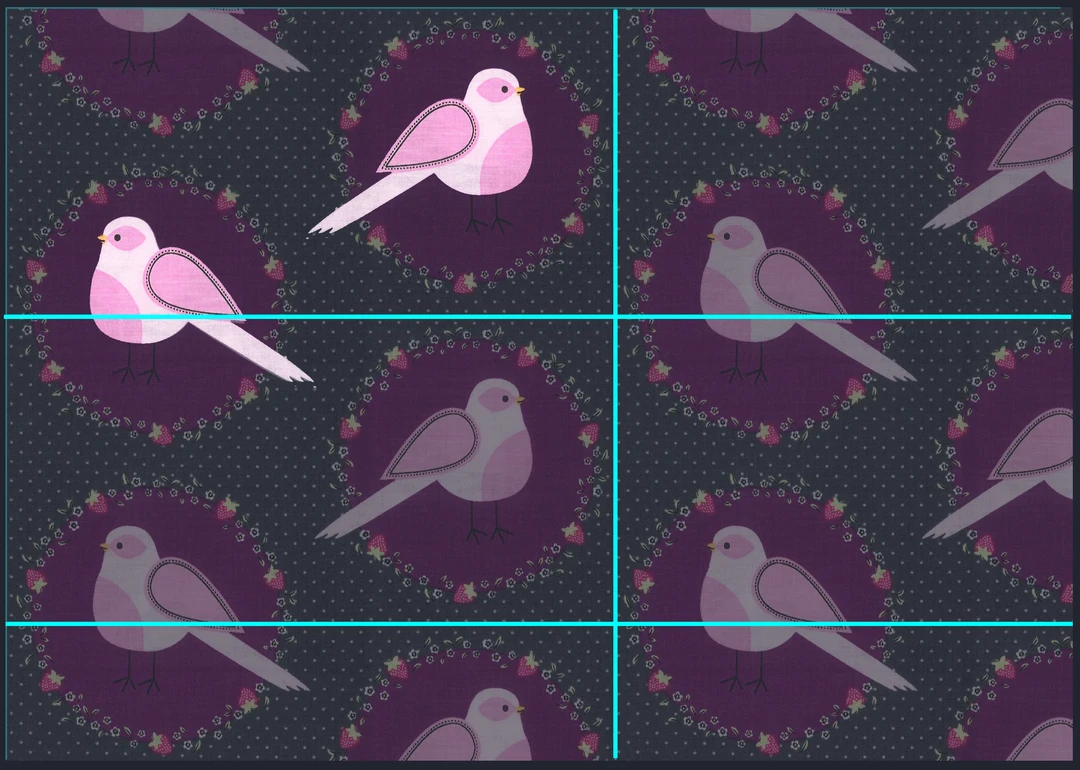
This is especially important for printed fabric in the textile industry, as it consists of repeated patterns in both the vertical and horizontal directions. Extraction a single pattern is useful in two ways. First, It provides buyers with the minimum quantity necessary to purchase without having an incomplete pattern. For example, one could consider purchasing two units in the vertical direction to have two birds in opposite direction in a single pattern, as shown in the Fig. 1 (b). Second, organizing a library by patterns can help designers find patterns more efficiently, ultimately speeding up the design process.
Detecting repeated patterns provides insights into objects. (a) Information about the structure and number. (b) Minimum quantity necessary to purchase without having an incomplete pattern.
(a)show hide
(b)show hide
2. Main challenge
Automating repetition detection remains a challenging task since the definition is unclear. For example, a checkerboard consisting of black and white has perfect repetition. However, it is often accompanied by irregularities, as shown in the Fig. 1 (a), the windows of the building are similar to each other, rather than being exactly the same in each pattern.
Several algorithms have been developed to address this deviation ( Citation: Liu, Collins & al., 2004 Liu, Y., Collins, R. & Tsin, Y. (2004). A computational model for periodic pattern perception based on frieze and wallpaper groups. IEEE transactions on pattern analysis and machine intelligence, 26(3). 354–371. ; Citation: Liu & Liu, 2013 Liu, J. & Liu, Y. (2013). Grasp recurring patterns from a single view. Proceedings of the IEEE conference on computer vision and pattern recognition. 2003–2010. ) , while others make assumptions with a nearly regular pattern ( Citation: Lettry, Perdoch & al., 2017 Lettry, L., Perdoch, M., Vanhoey, K. & Van Gool, L. (2017). Repeated pattern detection using CNN activations. 2017 IEEE Winter Conference on Applications of Computer Vision (WACV). 47–55. ) . In other words, assumptions are crucial for implementing an algorithm.
3. Program
Although it is a complex problem, fortunately, for our purposes, it is limited to printed fabric, which is both strictly regular and fronto-parallel due to its manufacturing process. As a result, our problem is as simple as detecting the perfect repetition of a checkerboard. The problem’s constraint depends on the resolution of the image, which in our case is 3500 x 4200 pixels.
Constraints:
- len(pixels) = 3500 x 4200
In the following analysis, we will use the notation $N$ to represent the total number of pixels in an image.
3.1. Approach with Fourier analysis
The intuitive method for identifying the period would be to use Fourier analysis, which is made efficient by using FFT. This results in a time complexity of $O(NlogN)$. However, since the basic idea behind Fourier analysis is an approximation by sums of simpler trigonometric functions, identifying the peak in spectrum can be challenging.
For instance, let’s say we perform Fourier analysis in the horizontal direction of a checkerboard. As shown in the Fig. 2 (a), the frequency of the maximum power corresponds to the pattern consisting of a pair of black and white squares. If we reduce the contrast, as also depicted in the Fig. 2 (b), humans can still effortlessly identify the pattern. However, the position of the maximum power in the spectrum shifts to a lower frequency. In other words, to find the same pattern as that perceived by humans, we need to specify the search range in the spectrum. Nevertheless, since there is no certain range of periodicity for images, this approach is not practical.
Performing FFT on a checkerboard image with different contrasts reveals that in low contrast images, the pattern corresponding to the frequency of maximum power in the spectrum differs from what humans process. (Resolution of image is 250 x 2500 pixels)
(a)show hide

(a)show hide

3.2. Approach with $L_2$ loss
This approach mimics human processing by sliding images to find their periodicity. In other words, it compares the pixels of images one by one, and uses the $L_2$ loss function as a metric for the distance between images. Here is how the algorithm works, as shown in the Fig. 3:
- Create a copy of the original image.
- Fixed one image as a reference and slide another.
- Calculate the loss in each RGB channel.
- Calculate the average loss for overlapped regions.
- Calculate the midpoint of the average loss function.
- Measure the distance between two midpoints while ascending or descending.
The size of the pattern can be extracted by performing the algorithm in both horizontal and vertical directions. The algorithm’s time complexity is $O(N^2)$ since we need to iterate through all pixels in each iteration. The space complexity is $O(N)$ because we create a copy of the original image.
Although the algorithm is $N^2$, all elements share the same computation at every step. Therefore, we can take advantage of vectorization by using Numpy. Additionally, it is necessary to resize the image for the algorithm, which involves a trade-off between runtime and accuracy.
Animation of the algorithm with $L_2$ loss.

4. Experiment
4.1. Dataset
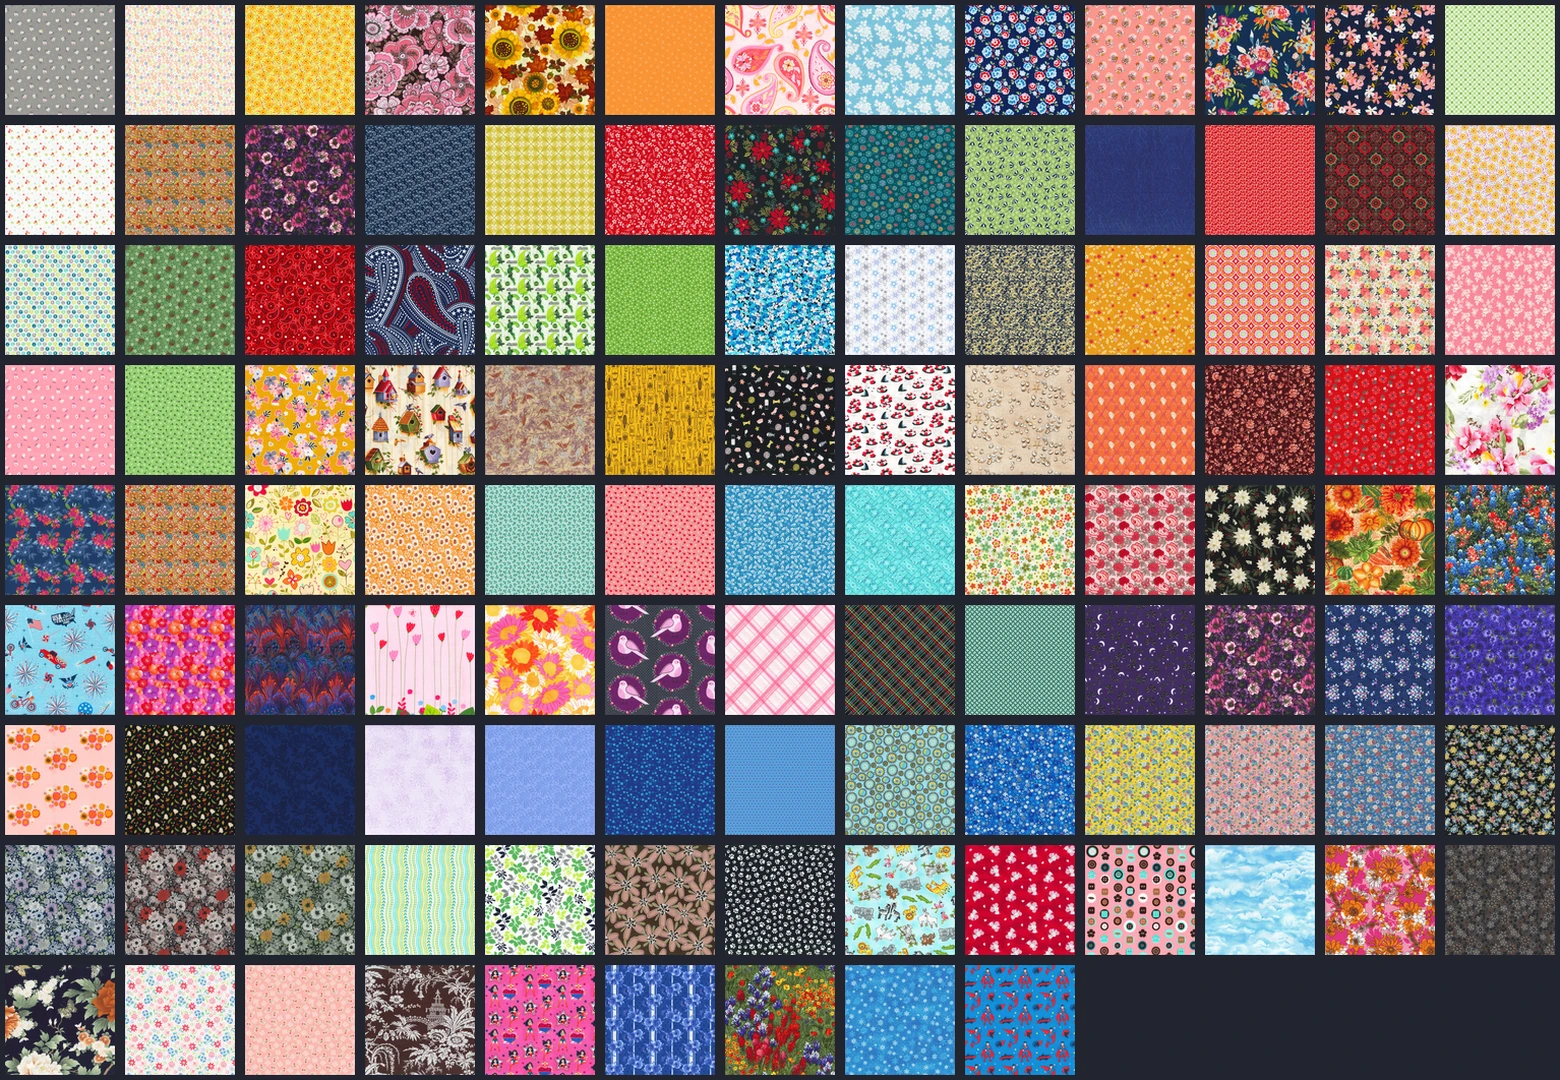
To test the speed and accuracy of our algorithm, we collected 113 digital images of fabric with dimensions of 30 cm x 42 cm (3500 x 4200 pixels), as shown in Fig. 4 (a). The pattern size was extracted manually using the same method as the algorithm, which involved shifting and comparing the image. The distributions of pattern size are shown in Fig . 4 (b)(c).
To evaluate speed, we had humans judge the pattern size of each image and measured the time taken for each judgment. For accuracy evaluation, we used the human judgment results as the ground truth.
(a) The dataset is used in experiments. Distribution of pattern size in the (b) horizontal and (c) vertical direction.
(a)show hide
(b)show hide
(c)show hide
4.2. Result
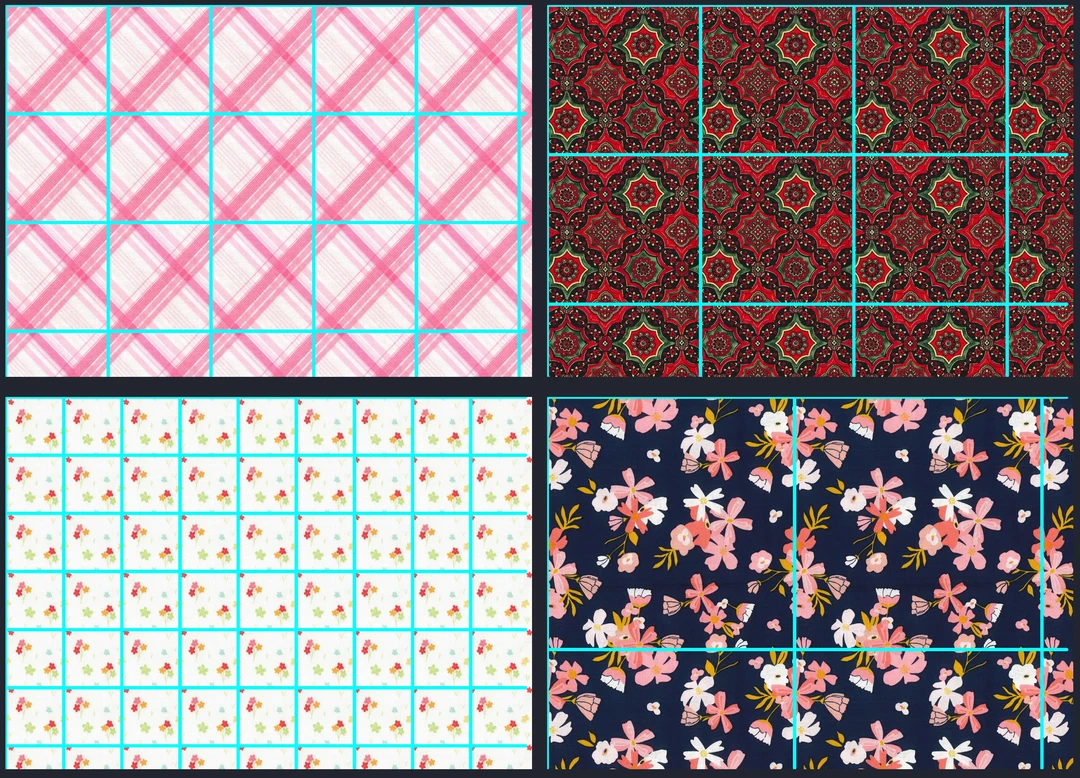
Fig. 5 provides examples of repeated patterns extracted from fabric. Fig. 6 (a) shows the results of runtime and accuracy, with both increasing as the resolution increases. At a resolution of 300 x 420 pixels, accuracy reaches 100% and runtime is 2.49 seconds. While the runtime is significantly longer than at 100 x 140 pixels, the algorithm still outperforms human processing, which takes 30 seconds per image. Therefore, the algorithm is 12 times faster than human processing, as shown in Fig. 6 (b).
Example of repeated patterns extracted in fabric.
(a) Both the accuracy and runtime increase as the resolution increases. (b) At 300 x 420 pixels, the algorithm achieves 100% accuracy and is 12 times faster than human processing. (plot is shown in log scale)
(a)show hide
(b)show hide
name
1x
name
1x
5. Conclusion
We present two approaches for detecting repetition in images. The first approach is based on Fourier analysis, but it is not suitable for our application because it requires additional assumptions about the range of the periods of images. The second approach emulates human processing by shifting and comparing images using the $L_2$ loss function. Despite its time complexity being $O(N^2)$, it outperforms human processing on our dataset.
Reference
- Lettry, Perdoch, Vanhoey & Van Gool (2017)
- Lettry, L., Perdoch, M., Vanhoey, K. & Van Gool, L. (2017). Repeated pattern detection using CNN activations. 2017 IEEE Winter Conference on Applications of Computer Vision (WACV). 47–55.
- Park, Brocklehurst, Collins & Liu (2009)
- Park, M., Brocklehurst, K., Collins, R. & Liu, Y. (2009). Deformed lattice detection in real-world images using mean-shift belief propagation. IEEE Transactions on Pattern Analysis and Machine Intelligence, 31(10). 1804–1816.
- Liu & Liu (2013)
- Liu, J. & Liu, Y. (2013). Grasp recurring patterns from a single view. Proceedings of the IEEE conference on computer vision and pattern recognition. 2003–2010.
- Liu, Collins & Tsin (2004)
- Liu, Y., Collins, R. & Tsin, Y. (2004). A computational model for periodic pattern perception based on frieze and wallpaper groups. IEEE transactions on pattern analysis and machine intelligence, 26(3). 354–371.