Design and Implementation of an in-House Fabric Library
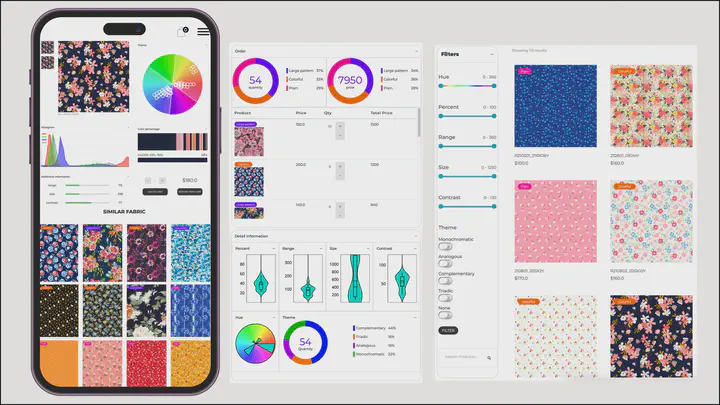
Table of Contents
Abstract
This document highlights the need for a fabric library to improve efficiency in fabric-related businesses. To specify the library’s requirements, we consider three aspects: System, User, and Administrator. Based on these requirements, we define a workflow for the fabric library that includes feature extraction, machine learning, and web services. The library is implemented using the Django framework and deployed on the Google Cloud Platform. Finally, we evaluate the impact of this library, resulting in up to a 4x improvement in fabric sales and a 50% reduction in the purchase process time.
1. Introduction
As a fabric-related business, much of our daily work involves sifting through piles of fabric and communicating with team members using fabric images. This process is time-consuming, exhausting, and inefficient. For example, a designer may spend an hour in the warehouse just to find a particular color and pattern of fabric. Additionally, images may be attached to emails, social media, or even printed out during discussions among team members, making it difficult to systematically compare or review results. To address these issues, we need to create an application that can assist team members in finishing their work more efficiently.
2. Objectives
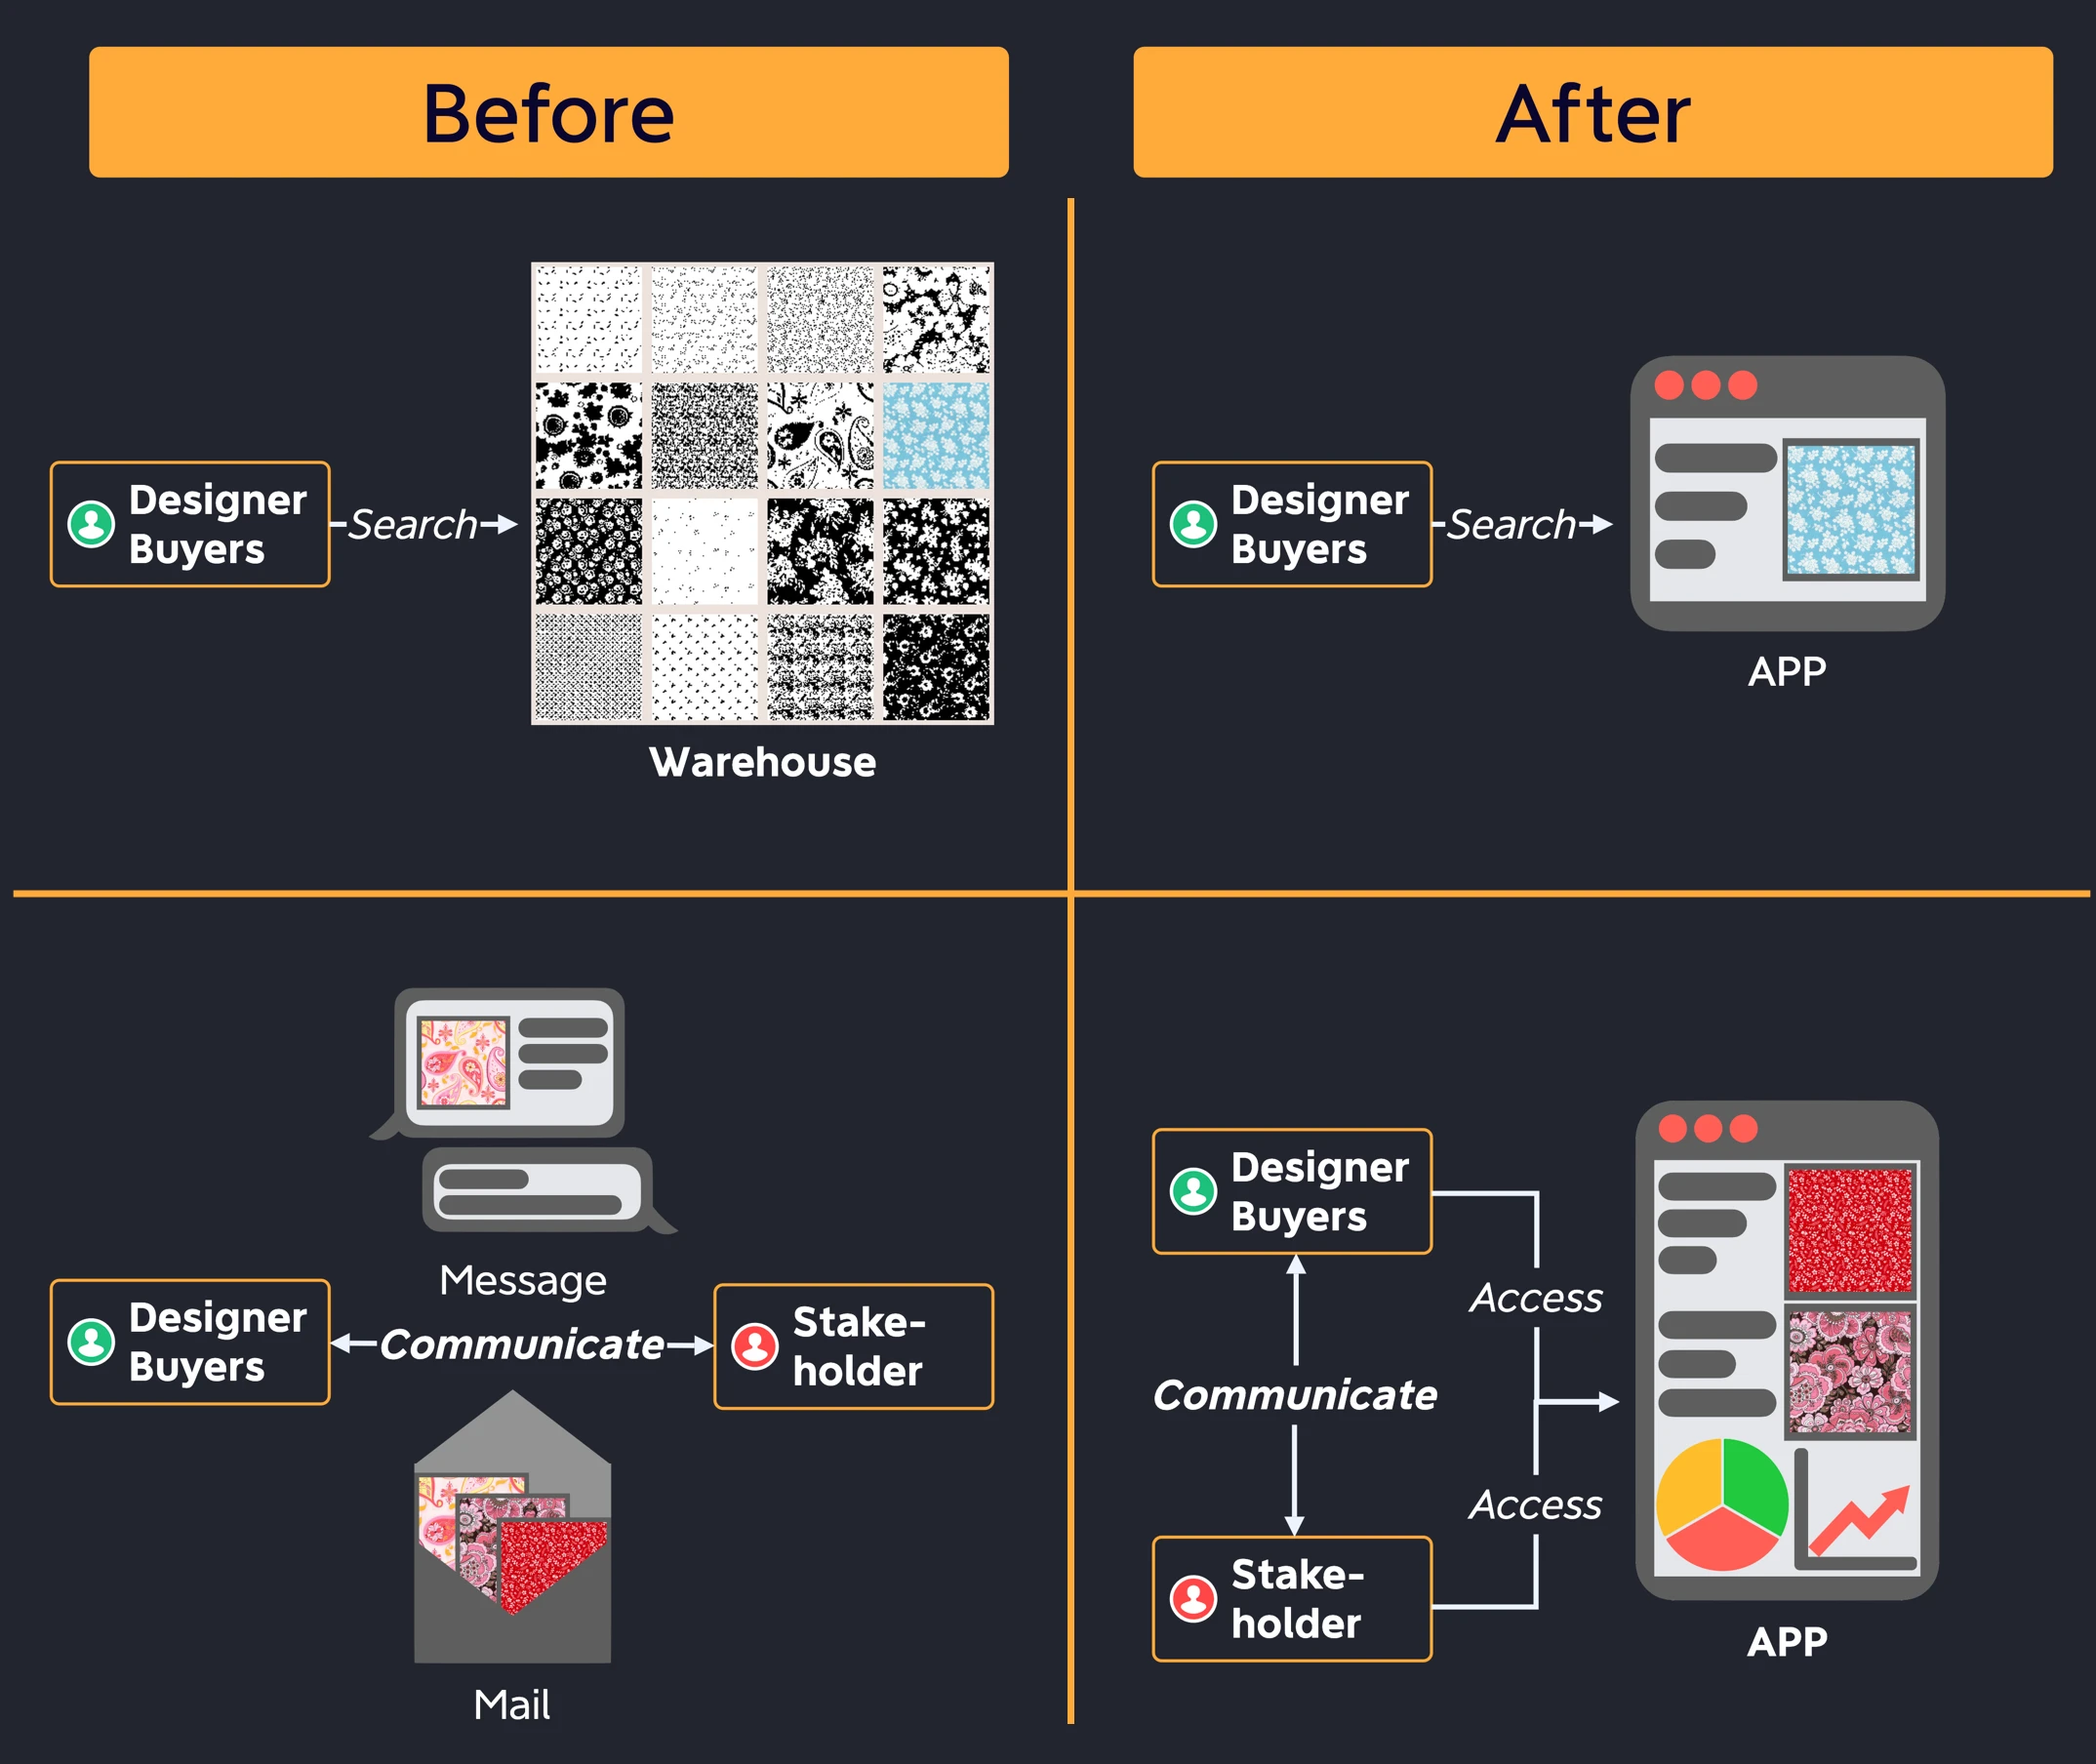
To be more specific, there are two parts in our original workflow that can be improved, as shown in Fig. 1:
- Reducing the time spent on searching for fabric.
- Before: Workers need to search through all the fabric in the warehouse to find the desired one.
- After: Workers can input desired features of the fabric into the application, which will retrieve all fabrics that match the input criteria.
- Streamlining the time spent on reviewing fabrics and making purchases more efficiently.
- Before: Workers and stakeholders are reviewing fabric using different tools, which can make it difficult for stakeholders to get a clear picture of all fabrics and can delay the decision-making process for purchases.
- After: Workers and stakeholders can have discussions based on the same information provided by the application. Additionally, the application’s data visualization and machine learning-based predictions can provide valuable insights into the fabric.
The figure illustrates two scenarios: the original workflow before using the application, and the workflow after use of the application.
3. Requirement
To achieve our goals, we can break down the requirements of our application into three aspects: “System”, “User”, and “Administrator”.
- System:
- Store and display information about fabrics
- Extract features from fabrics
- Use machine learning (ML) models to make sales predictions
- Provide a dashboard summarizing each order
- User:
- Search and filter fabrics
- Retrieve similar fabrics
- Add fabrics to orders
- Administrator:
- Evaluate results from ML models
- Batch update the database
Regarding the requirements of the System, it should be able to store fabric information and display it to users. Additionally, it needs to extract features from the fabric so that users can search, filter, and retrieve similar fabric based on those features. Furthermore, the extracted features can be used in ML models to predict sales and can also be used in a dashboard to help stakeholders or buyers have a clearer view of the order list, enabling them to make decisions more efficiently.
For User, in addition to searching for fabric, they should be able to add fabrics to their wishlist, cart, or order. As for the Administrator, metrics should be defined so that they can evaluate the ML models that make predictions on sales. Since the supplier will frequently provide new fabrics, batch updates are preferable instead of updating them one by one.
4. Workflow
The workflow can be designed logically by considering all the requirements, as shown in Fig. 2.
Workflow of our application
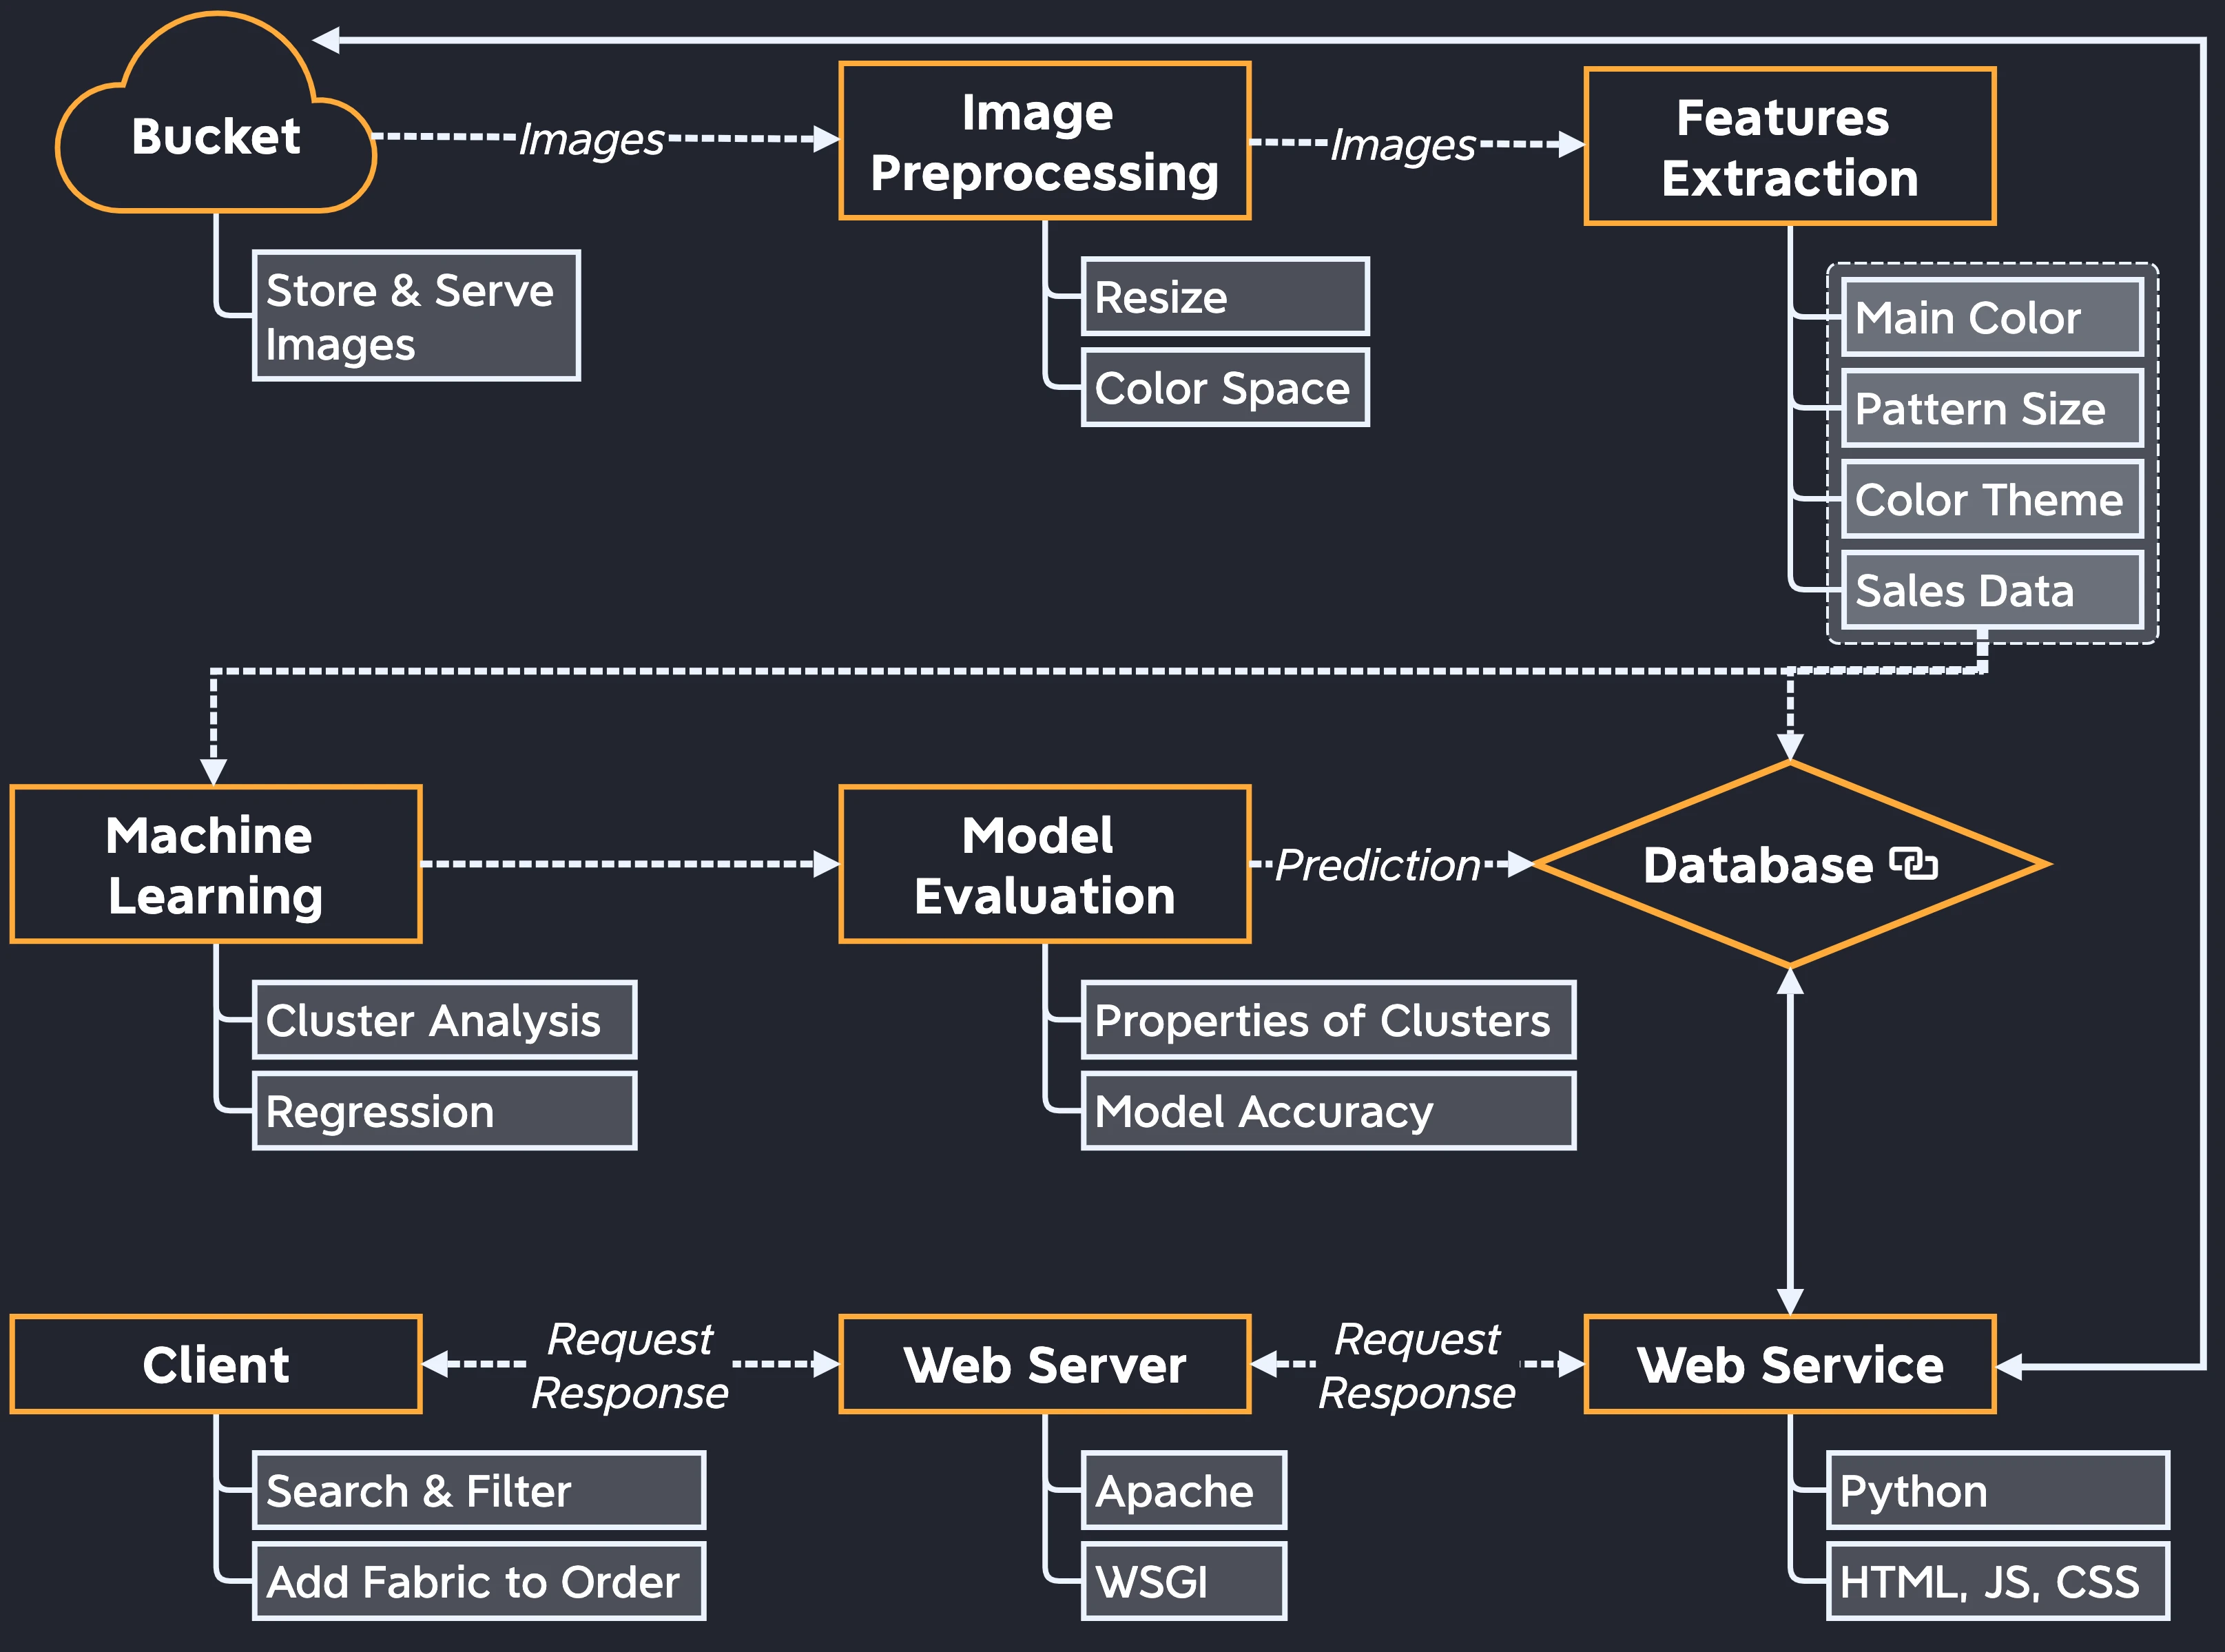
Bucket: To allow fabric suppliers to upload images of fabrics and serve them to our web service, we need to create a cloud storage bucket.
Image Preprocessing: Images added to the bucket need to be resized to reduce runtime in feature extraction. Additionally, converting the color space from RGB to HSV is necessary for color theme extraction.
Features Extraction: During this stage, features such as the main color, pattern size, and color theme are extracted. Furthermore, we need to obtain sales data for each fabric to use as a target for machine learning.
Machine Learning: At this stage, we perform both supervised and unsupervised learning, as described in the Implementation Details section.
Model Evaluation: When using machine learning techniques, corresponding metrics are used to evaluate the models. For example, in linear regression, the $R^2$ metric is used for accuracy assessment.
Database: The extracted features and predictions from ML models will be updated in the database.
Web Service: We use Python for the backend and HTML, JavaScript, and CSS for the frontend to create a web service.
Web Server: Since we are using Python on the backend, we can transfer HTTP requests and responses using WSGI. This can be accomplished by using Apache and its modules.
Client: Our system only requires three functions for users: searching and filtering fabrics, retrieving similar fabrics, and adding fabrics to an order.
5. Result
Our web service consists of a main page, fabric detail pages, and an order summary page, all shown in the Fig. 3.
Pages in our application.
Main Pageshow hide
Fabric Detail Pagesshow hide
Order Summary Pageshow hide
5.1. Main Page
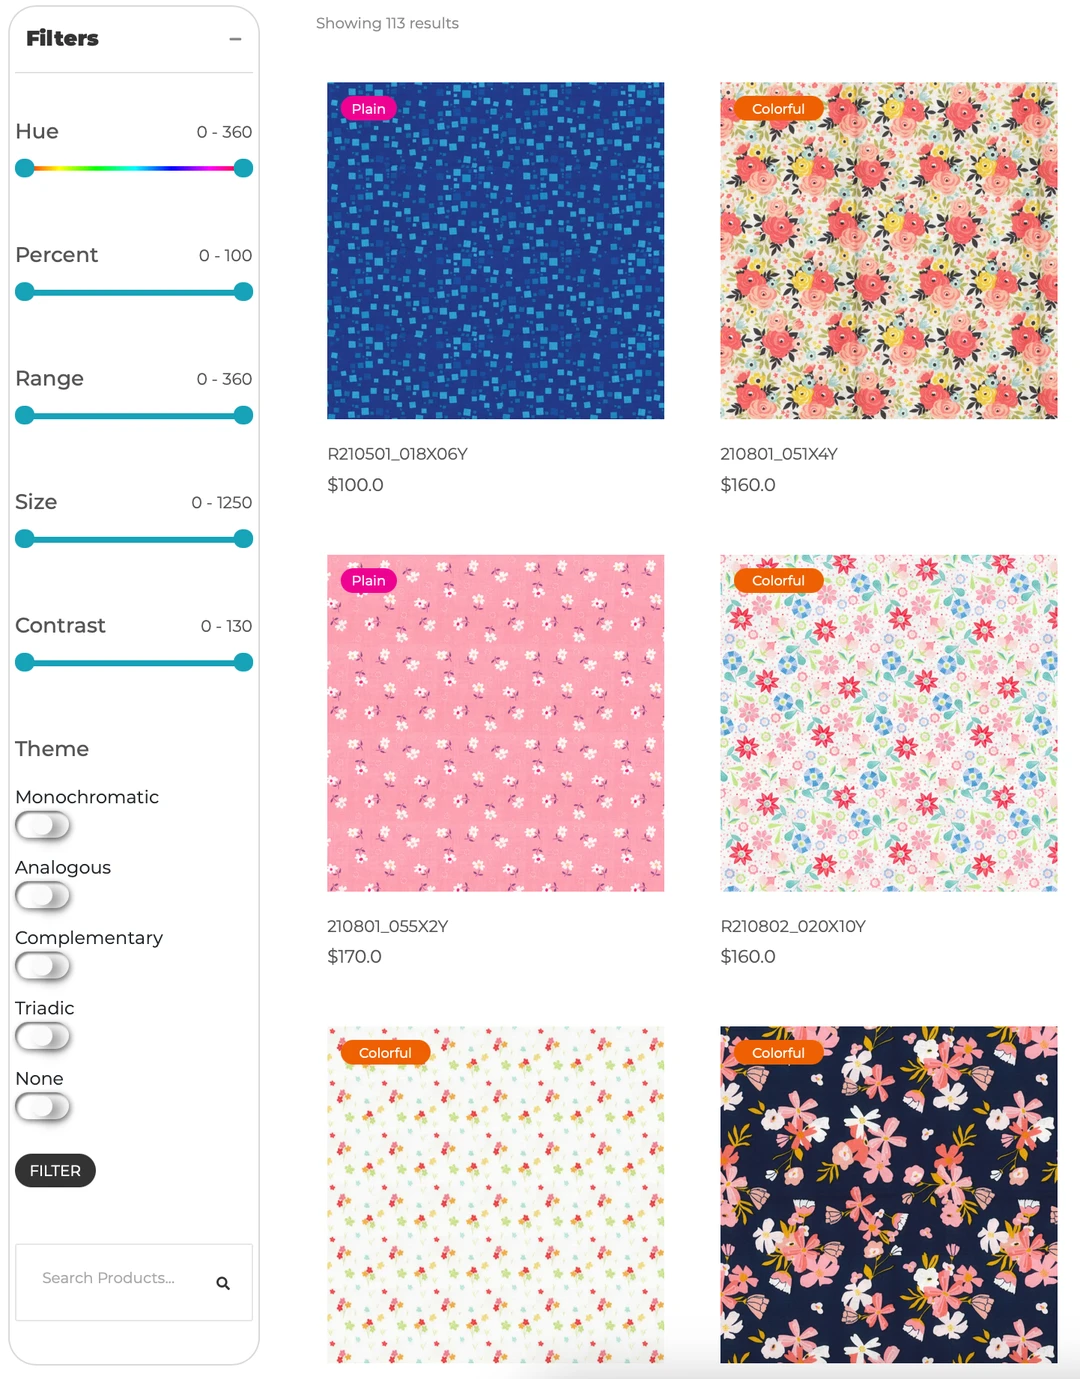
On the left side of the webpage, there are multiple sliders that can be used to filter the range of each feature, including color, pattern size, contrast, and so on. The web page will then display fabrics that match the selected criteria. As for the color theme, since it is a categorical feature, it is designed as a checkbox. Additionally, users can input a fabric ID to retrieve specific fabrics.
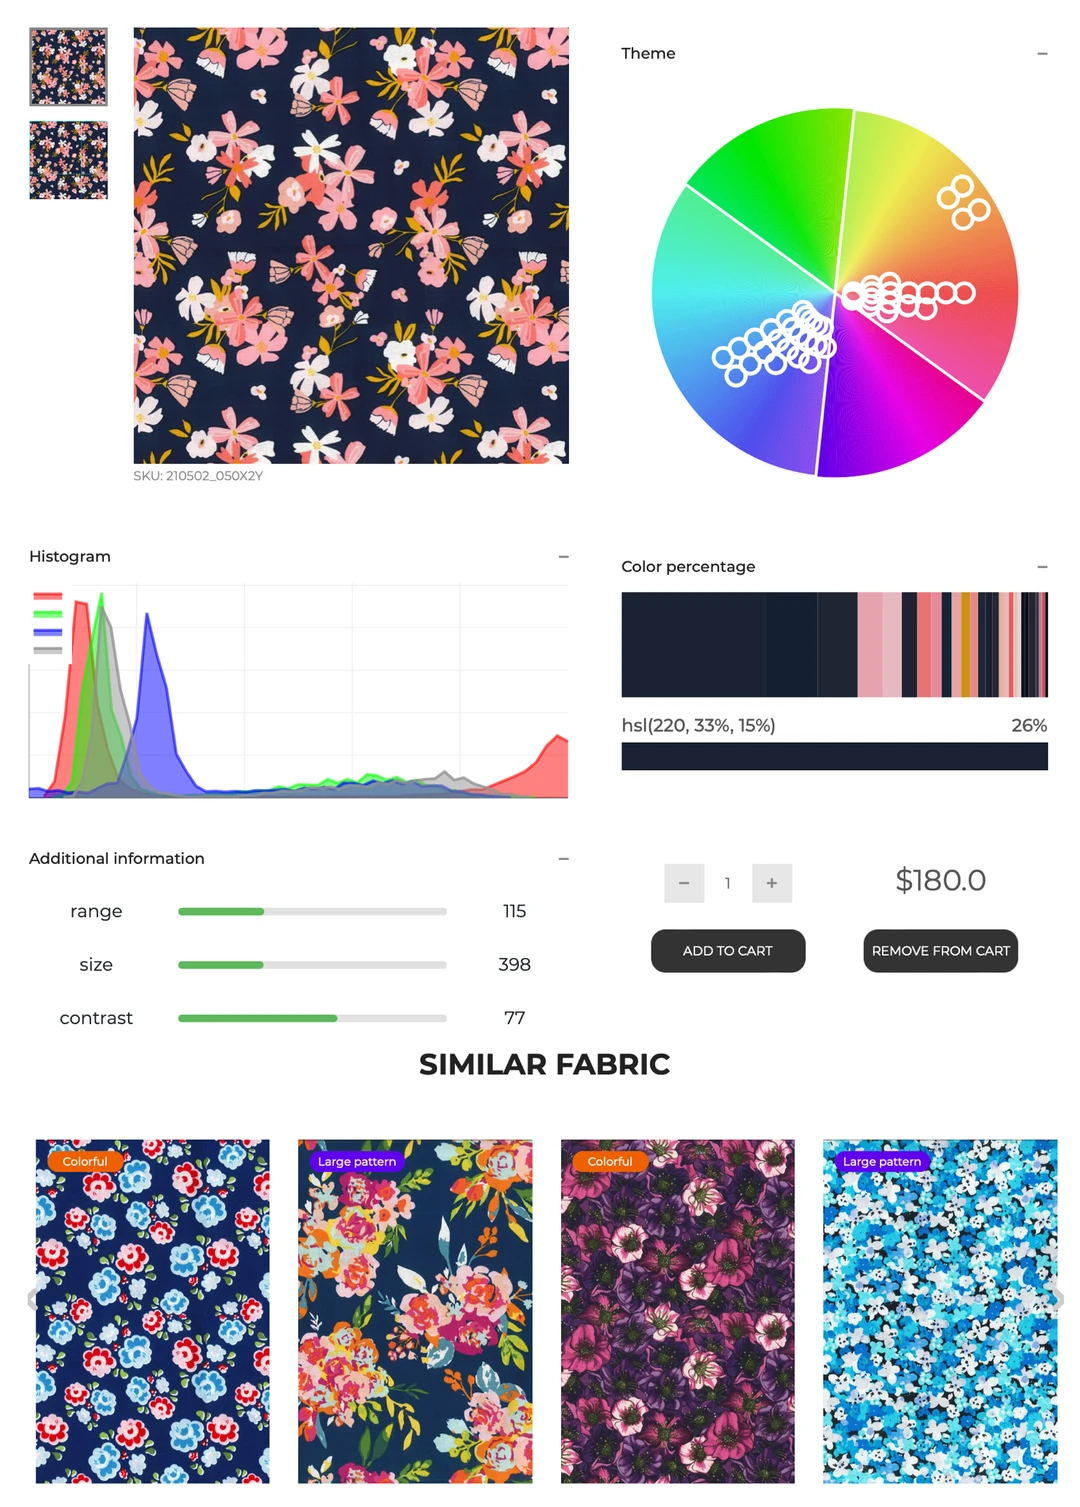
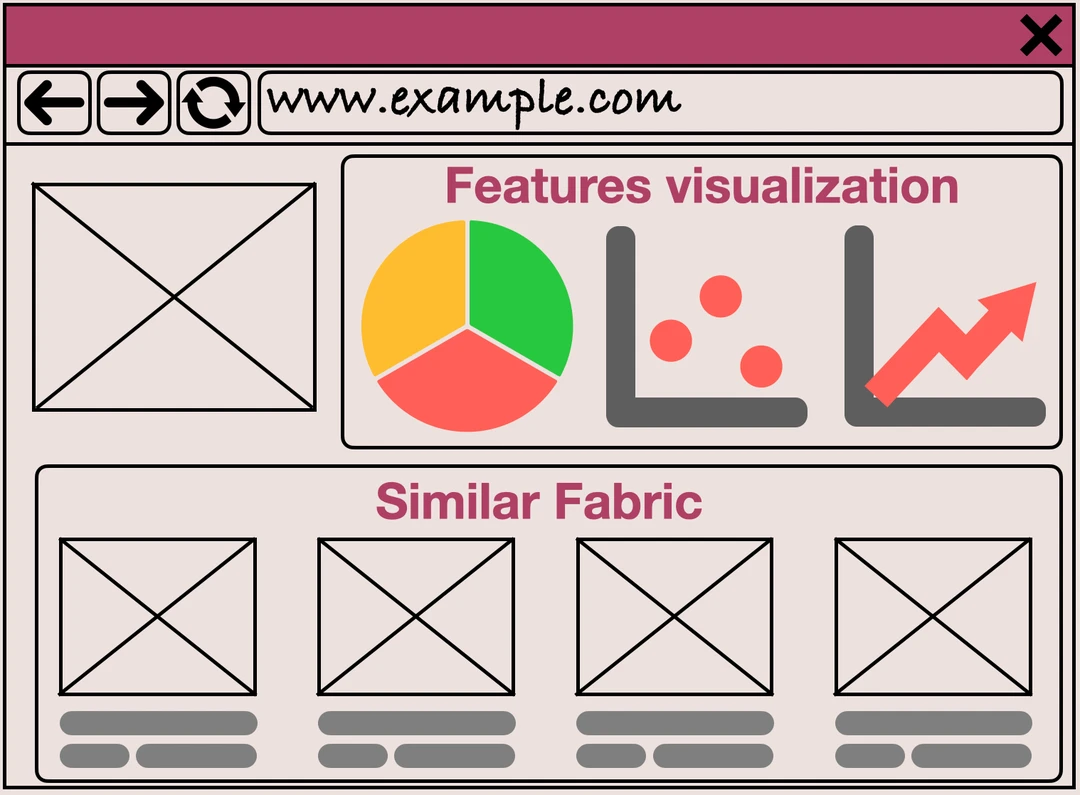
5.2. Fabric Detail Pages
The polar plot displays the color theme and range. Additionally, histograms of each channel are shown, and the percentage of each color is displayed. Quantitative features such as pattern size and contrast are also included. Finally, the top 12 options for similar fabrics are listed at the bottom of the page.
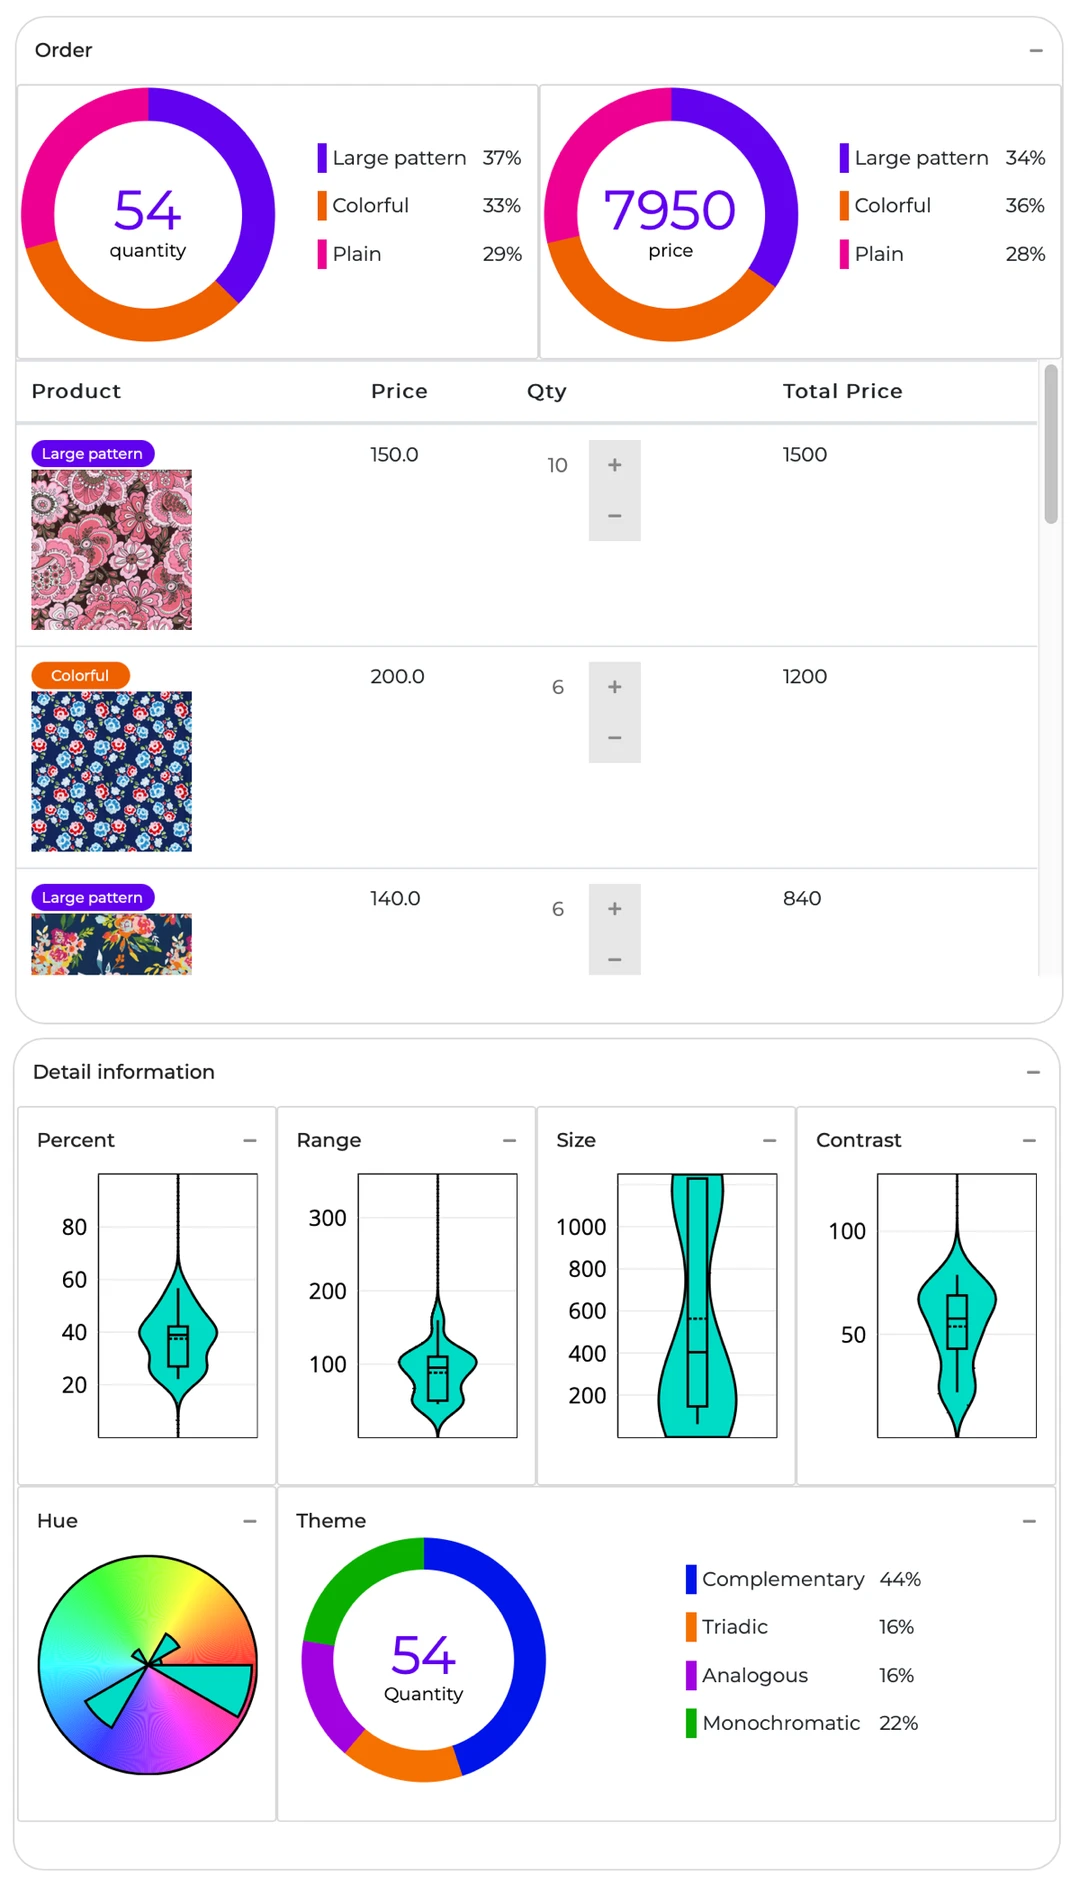
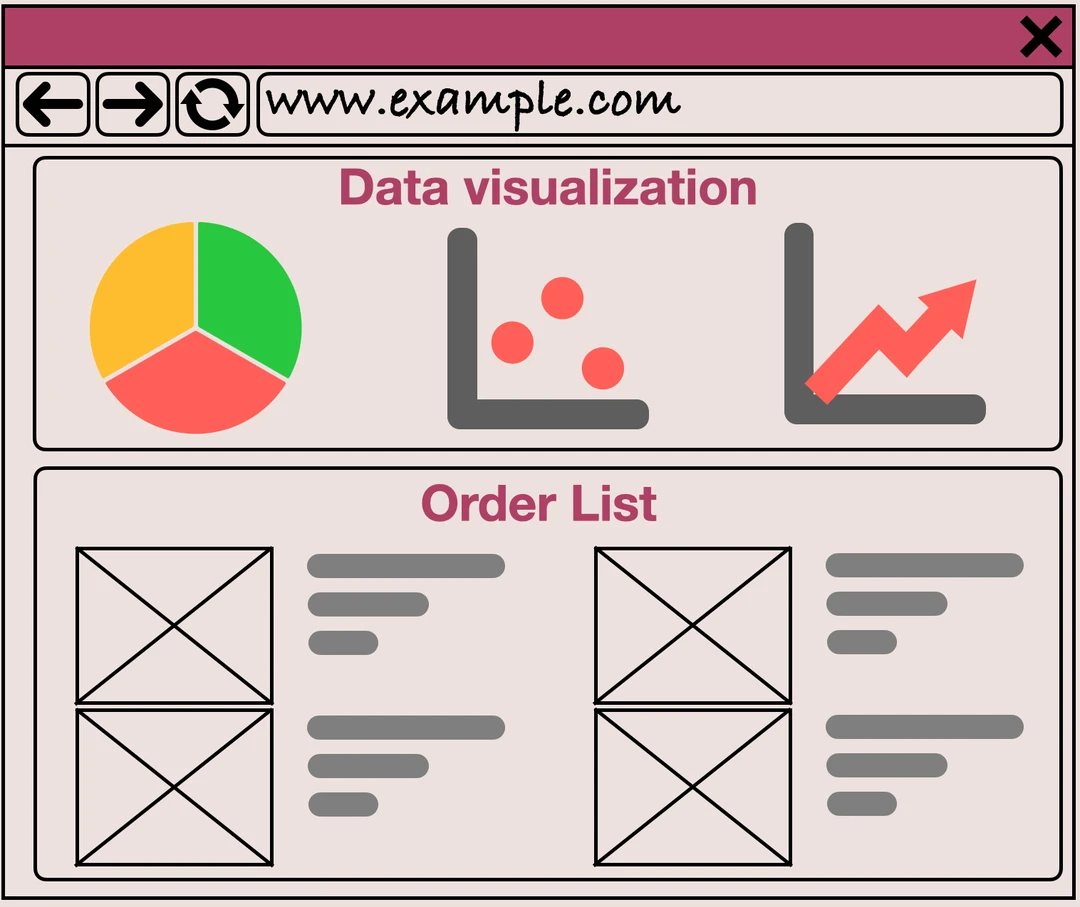
5.3 Order Summary Page
This page serves as an interactive dashboard that not only summarizes the order for the user, but also allows the user to adjust the quantity of fabric to see its impact on the order.
At the top of the page, there are two pie charts displaying the labels predicted by K-means. These charts remind the user about the proportion of each label. A higher proportion of a specific label, especially “Plain”, may be risky for sales, as discussed in the previous project.
The price and quantity of the order are displayed in the center of the page. Users can adjust the quantity using buttons provided.
Finally, the features of the fabrics are summarized using a violin plot and a pie chart located at the bottom of the page, which provide insight into the distribution of the features.
5.4 Impact
5.4.1. Efficiency
During the feature extraction stage, we implement algorithms that achieve 12x and 63x improvements in speed compared to human processing for extracting pattern size and color themes, respectively$^1$ $^2$.
When it comes to finding similar fabrics, defining the metric can be difficult due to the subjective nature of fabric images. However, the implemented algorithm has been proven to retrieve fabrics that are similar to those perceived by humans$^3$.
5.4.2. Sales
Thanks to our in-house library and the hard work of our team members, sales have increased significantly since 2018, as shown in Fig. 4. We have observed up to a 2.73 improvement compared to 2017. Additionally, we have reduced the process time for each purchase by 50%, as discussed in a previous project.
Fabric sales per quarter have been tracked since 2017. Since 2018, the purchase process has incorporated the in-house library, which has led to higher sales. Different colors indicate the before and after implementation.
6. Conclusion
We take a systematic approach to building an in-house library for fabric. This approach includes analyzing requirements, selecting a framework, implementation, and deployment. The library has proven to be useful in significantly increasing sales and reducing the time required for the purchase and design process.
7. Appendix: Implementation Details
7.1. Framework
As Python is our main programming language, we have opted to use the Django framework to construct our web service. This framework offers all the essential components and features, including frontend development with JavaScript, HTML, and CSS, and backend interaction through an object-relational mapper (ORM).
7.2. Image Preprocessing and Feature Extraction
We use OpenCV with Python for image manipulation tasks, such as importing, exporting, resizing, and color space conversion. We also implement our own algorithm to extract features, including color themes and pattern sizes. Similar fabrics are also considered as a feature and are extracted based on perceptual similarity.
7.3. Machine learning and Model Evaluation
We perform dimensionality reduction, K-means clustering, and beta regression on the extracted features. The procedure and results are discussed in the previous project.
7.4. Database
7.4.1. Schema
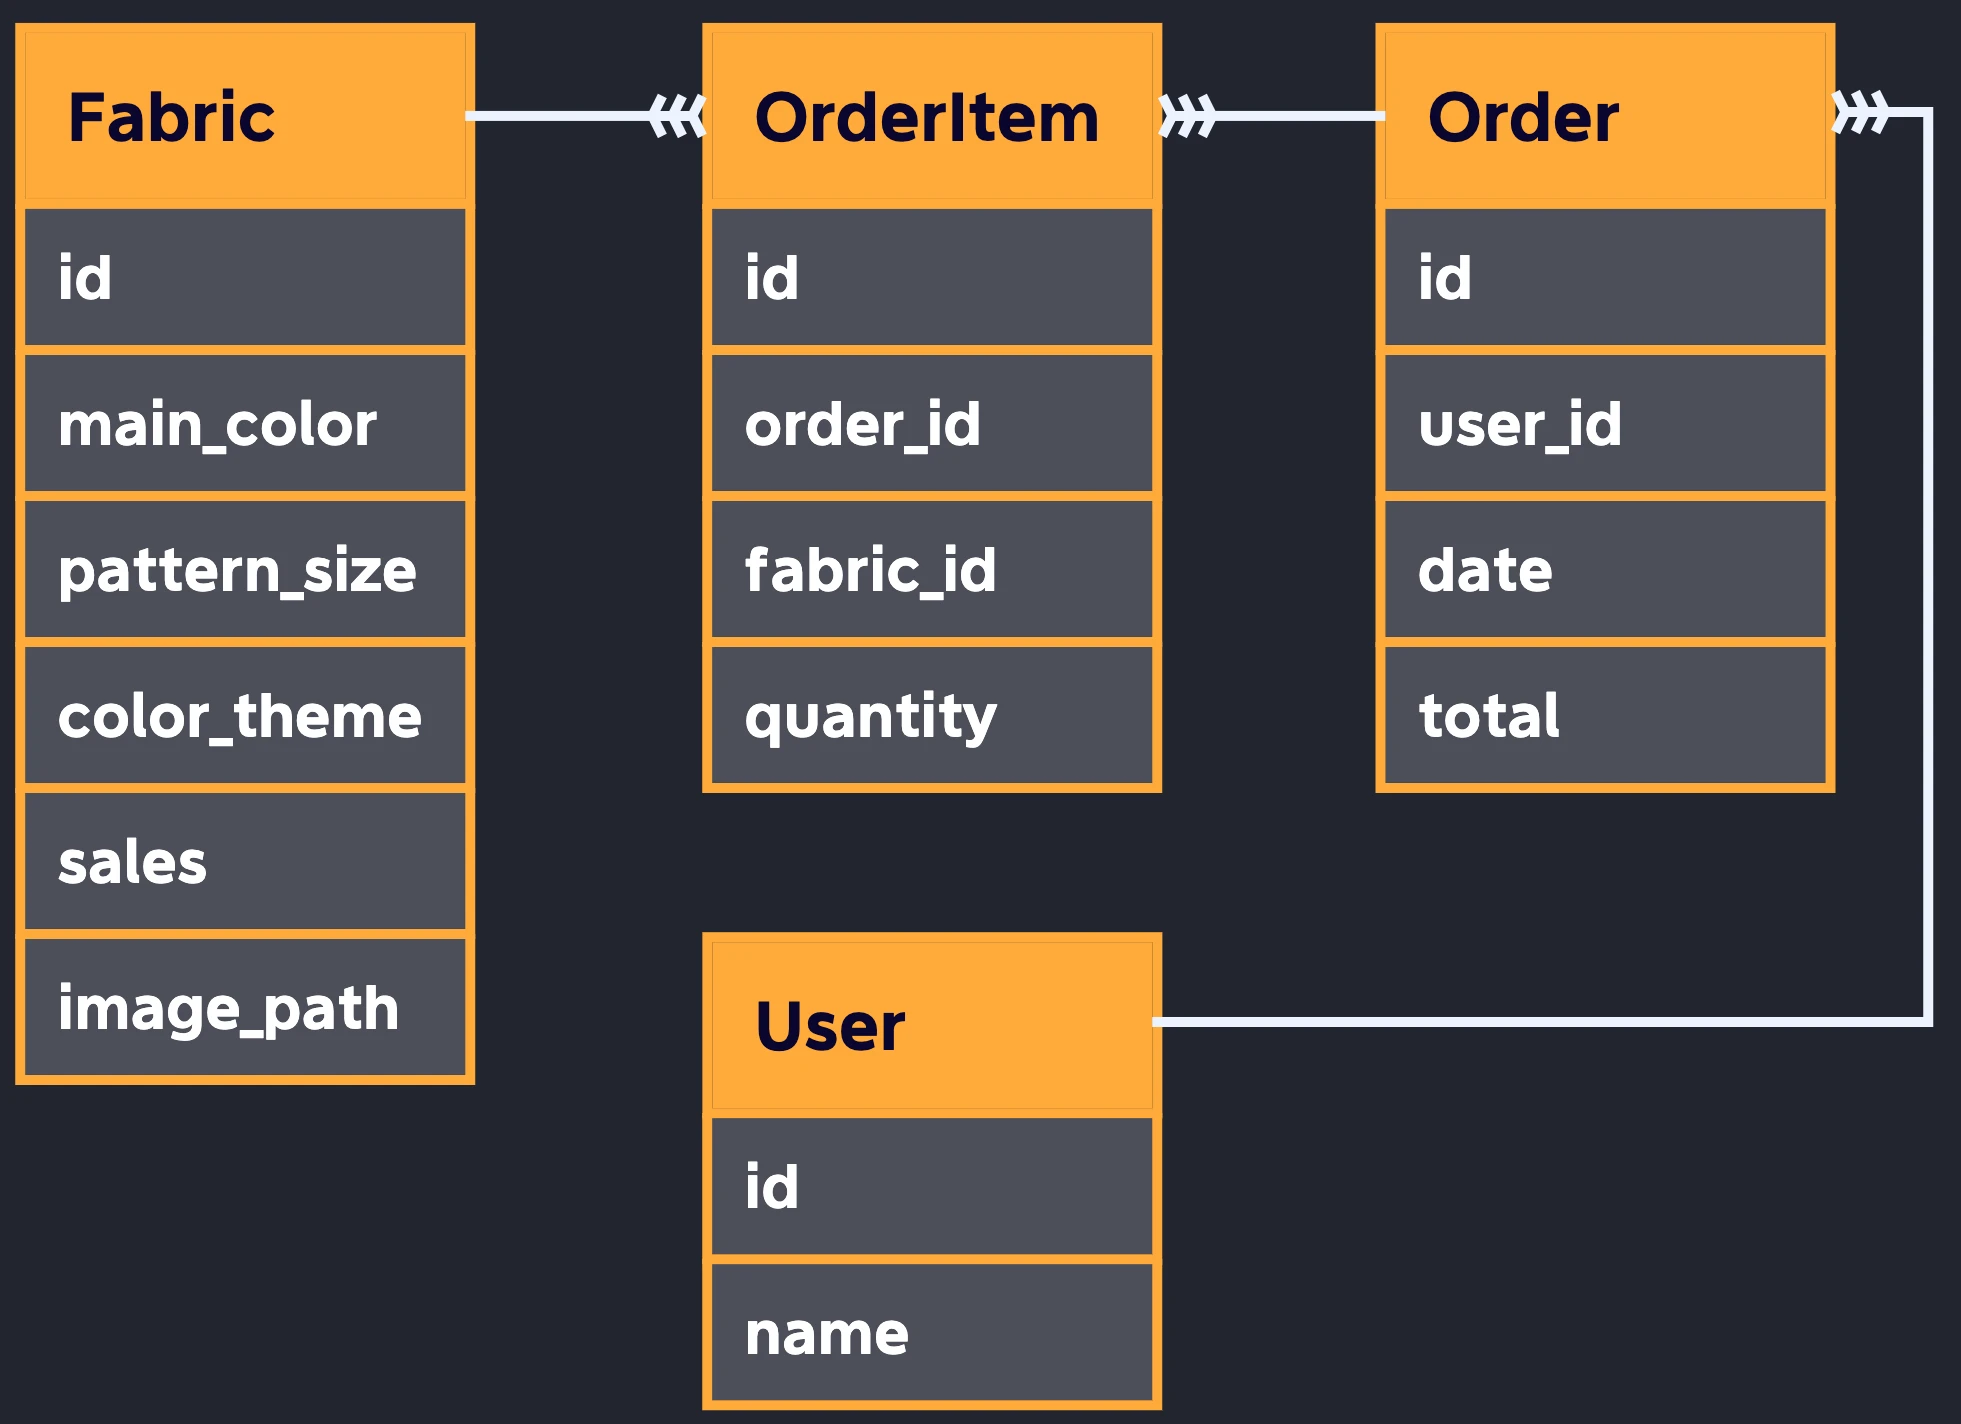
Fig. 5 provides a simplified schema as an example. We have created a “Fabric” table to store the features of fabrics. For each item in an order, we create an “OrderItem” table and use “order_id” and “fabric_id” as foreign keys. Lastly, for each order, an “Order” table is created, with “user_id” used as the foreign key.
The simplified schema of our database.
7.4.2. Batch update
To perform batch updates in a database using Django, we create a custom django-admin command. The following is an example of importing CSV data and writing it into the “Fabric” table in a database.
class Command(BaseCommand):
    help = "load fabric data"

    def handle(self, *args, **options):
        # Custom function for loading data in CSV format
        data = load_data(file="./example.csv")

        for i in range(1, len(data)):
            # Write data to each column
            row_data = {}
            row_data["fabric_name"] = data[i][0]
            row_data["main_color"] = data[i][1]
            ...
            # Save data to Fabric table
            item = Fabric(**row_data)
            item.save()
7.5. Web Service
We use Django’s class-based views to build our web pages. Setting up the connection with the database and template only requires few lines of code. Additionally, built-in pagination can be used to achieve multi-page content.
class ShopView(ListView):
    model = Fabric  # Table name in database
    paginate_by = 6  # 6 items for each page
    template_name = "shop/shop.html"
Meeting user requirements for filtering or searching fabric involves setting up a frontend user interface to receive user requests and a backend to query the database.
To achieve this on the frontend, a classic range slider and a checkbox can be used. On the backend, we need to use the “setup” method to receive these requests from the frontend, parse them, and make a query to the database using “get_queryset”. The following code provides an example of how to filter content in shop.html based on a user’s request for a specific hue range.
class ShopView(ListView):
    model = Fabric  # Table name in database
    paginate_by = 6  # 6 items for each page
    template_name = "shop/shop.html"
    filters = {}

    def setup(self, request, *args, **kwargs):
        """Initialize attributes shared by all view methods."""
        super().setup(request, *args, **kwargs)
        self.parse_request()

    def get_queryset(self):
        """Make queries to the database."""
        new_queryset = Fabric.objects.filter(**self.filters)
        return new_queryset

    def parse_request(self):
        """Receive request and update to filter for queryset"""
        low = self.request.GET.get("hue_low")
        high = self.request.GET.get("hue_high")
        self.filters["hue__range"] = [low, high]
Another requirement is to keep track of the order list across different pages. This can be achieved by using cookie in frontend. The following example demonstrates how to update a cart’s content in a cookie using JavaScript.
function updateCart(cart){
    document.cookie = "cart=" + JSON.stringify(cart)
}

function updateQuantity(fabricName, quantity, cart) {
    if (fabricName in cart) {
        cart[fabricName] = parseInt(cart[fabricName]) + parseInt(quantity)
    } else {
        cart[fabricName] = parseInt(quantity)
    }
    updateCart(cart)
}
7.6. Web Server
As our web service is built with Python, we can use WSGI to forward requests from the web server. Apache with mod_wsgi provides a simple way to set up a directory for Python scripts, and virtual environments in the configuration file. The following code provides an example:
<Macro DjangoWSGI $document $script>
    WSGIDaemonProcess demo python-home="$script/venv" python-path="$script"
    WSGIProcessGroup demo
    WSGIScriptAlias / "$script/site_settings/wsgi.py"
    <Directory "$script/site_settings">
        <Files wsgi.py>
            Require all granted
        </Files>
    </Directory>
</Macro>
7.7. Client (User Interface)
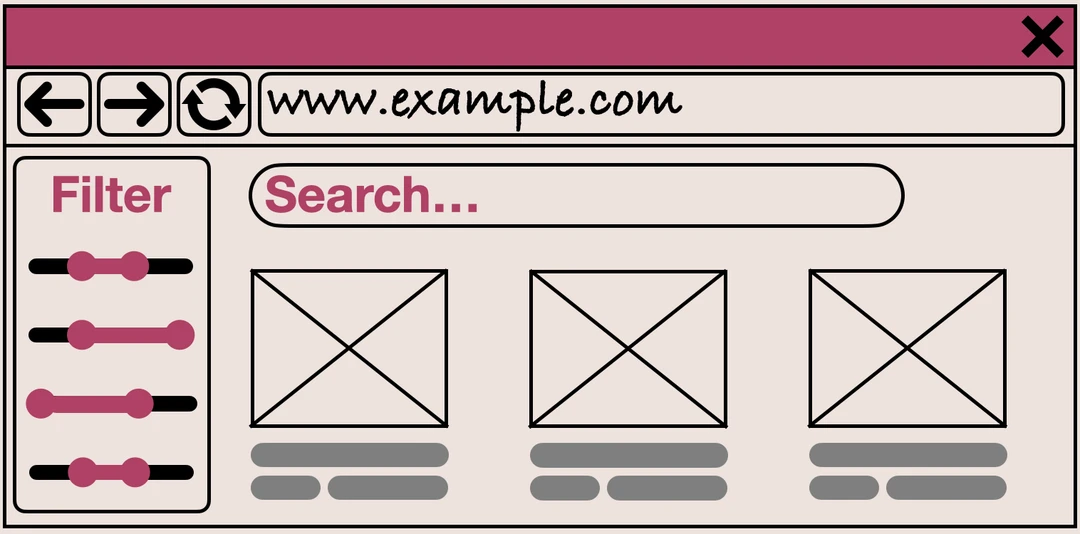
We have created three pages for our user interface based on our requirements: the main page, fabric detail pages, and order summary page, as shown in Fig. 6.
Draft layout of the user interface.
Main Pageshow hide
Fabric Detail Pagesshow hide
Order Summary Pageshow hide
7.7.1. Main Page
We use range sliders to allow users to specify the range of each feature. A search box is used to retrieve fabric based on the fabric’s ID.
To create range sliders, begin by adding three progress bars that will serve as its appearance.
<div class="wrap-filter-bar">
    <div id="hue-filter-bar">
        <div class="hue-progress"></div>
        <div class="hue-progress-mask-left"></div>
        <div class="hue-progress-mask-right"></div>
    </div>
</div>
Next, add two inputs to specify the upper and lower bounds of the feature.
<div class="hue-input">
    <div class="field">
        <label for="hue_min">
            <input type="range" id="hue_min"...>
        </label>
        <label for="hue_max">
            <input type="range" id="hue_max"...>
        </label>
   </div>
</div>
Add an event listener to each input to update the progress bars based on the user’s input.
function slider(name, gap) {
    // Retrieve html elements
    let rangeInput = document.querySelectorAll(`.${name}-input input`);
    let progress = document.querySelector(`.leftbar #${name}-filter-bar .${name}-progress`);
    let progressMaskLeft = document.querySelector(`.leftbar #${name}-filter-bar .${name}-progress-mask-left`);
    let progressMaskRight = document.querySelector(`.leftbar #${name}-filter-bar .${name}-progress-mask-right`);

    // Add event listener
    rangeInput.forEach(input => {
        input.addEventListener("input", function (event) {
            // Retrieve value from input
            let minVal = parseInt(rangeInput[0].value)
            let maxVal = parseInt(rangeInput[1].value)

            // Update progress bar
            if (maxVal - minVal < gap) {
                if (event.target.className === `${name}-min`) {
                    rangeInput[0].value = maxVal - gap;
                } else {
                    rangeInput[1].value = minVal + gap;
                }
            } else {
                updateProgressAndDisplay(...);
            }
        });
    });
}
Finally, create a button to submit the input values to the backend.
<button type="submit">Filter</button>
A search box can be created simply by using HTML.
<div class="search-product">
    <form class="search-box" method="GET" action="">
        <label for="search-product">
            <input type="text"
                   name="search-product"
                   id="search-product"
                   placeholder="Search Products...">
        </label>
        <button type="submit"></button>
    </form>
</div>
7.7.2. Fabric Detail Pages and Order Summary
The primary goal is to visualize the features for each fabric and summarize the order with plots. To achieve this, we rely on Plotly, JavaScript, and CSS, as they provide interactive and responsive plots for users. For example, a scatter plot can be created by providing the id of the HTML element and the x and y data, respectively.
function scatterPlot(plotID, x, y) {
    let data = [
        {
            x: x,
            y: y,
            type: "scatter",
            mode: "line",
        }
    ];
    Plotly.newPlot(plotID, data)
}
7.8. Cloud provider
We chose Google Cloud Platform (GCP) as our cloud provider because it has the lowest latency of 18 ms in Taiwan compared to AWS and Azure. Although GCP provides many convenient options for deploying a web service, such as App Engine or Cloud Run, we have chosen to use Compute Engine. The reason for this is that it allows for more precise control and direct management of virtual machines (VMs). For instance, we can select CPU and RAM according to our budget, and choose a region with the lowest latency.